Excel chart question for homework
PostPosted: Sun Feb 08, 2009 2:02 pm
I need to do a chart for a finance project. I was thinking of a bar chart. I would like something I can adjust to go straight across from one section to another. I want to have the percent on the left where hight is measured and the dollar values on the bottom. I want to get the dollars on the bottom, because I'm going to show another chart next to it, that I still need to make, where the decrease in return in a series of arranged projects is shown in contrast to an increase in the cost of capital used to fund projects.
Bottom line for my problem, I don't know how to get the numbers for the capital raised ($numbers) to show on the bottum.
I have Excel 2003. Excel seems to insist on putting the dollar signs on the left. I have colums number 1, 2, 3, and 4 that show up automatically.
From $0 to $106,000,000, my rate is 2.9%. From $106,000,000 to $130,800,000, it is 3.2%. After that, it is 11%. After $400,000,000, there is no more capital and the chart ends.
What do I do to show this?
I have tried the following:
$%
$%
$%
$ $ $
%%%
With this following one, I still get the same dollar values with percents on the left and 1, 2, 3, on the bottom. I illustrate another set up with I got that below.
%$
%$
%$
And when I use:
2.9% 3.2% 11.0% 11.0%
$- $106,000,000 $130,800,000 $400,000,000
I get:
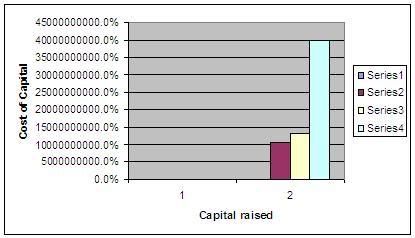